
In brief
- The odds on the Myriad market for “XRP’s next hit” have shifted dramatically.
- The bears have taken over as the price of XRP dips below critical levels.
- Can XRP regain support, or will bears send the Ripple-linked token back down to $2?
What a difference a week has made for XRP.
Just last week, it looked like the stars were aligning for members of the XRP Army. The Ripple-linked token had just come off an all-time high price of $3.65—a record that had stood for eight long years—and the bullish vibes were back. Now? Not so much.
On Myriad, a prediction market created by Decrypt’s parent company Dastan, users last week placed the odds of XRP hitting $4 at 66%. Fast forward to today, and those odds have collapsed to a coin flip: 51% for the “moon” scenario of $4, and 49% for the “doom” outcome of $2. Those odds are slightly better than they were yesterday when bears had decisively flipped the mood and priced the $2 scenario at 61%. Either way, it’s a fairly stunning reversal in sentiment.
What explains the change? Let’s take a look at the charts:
XRP price: A breakdown that changes everything
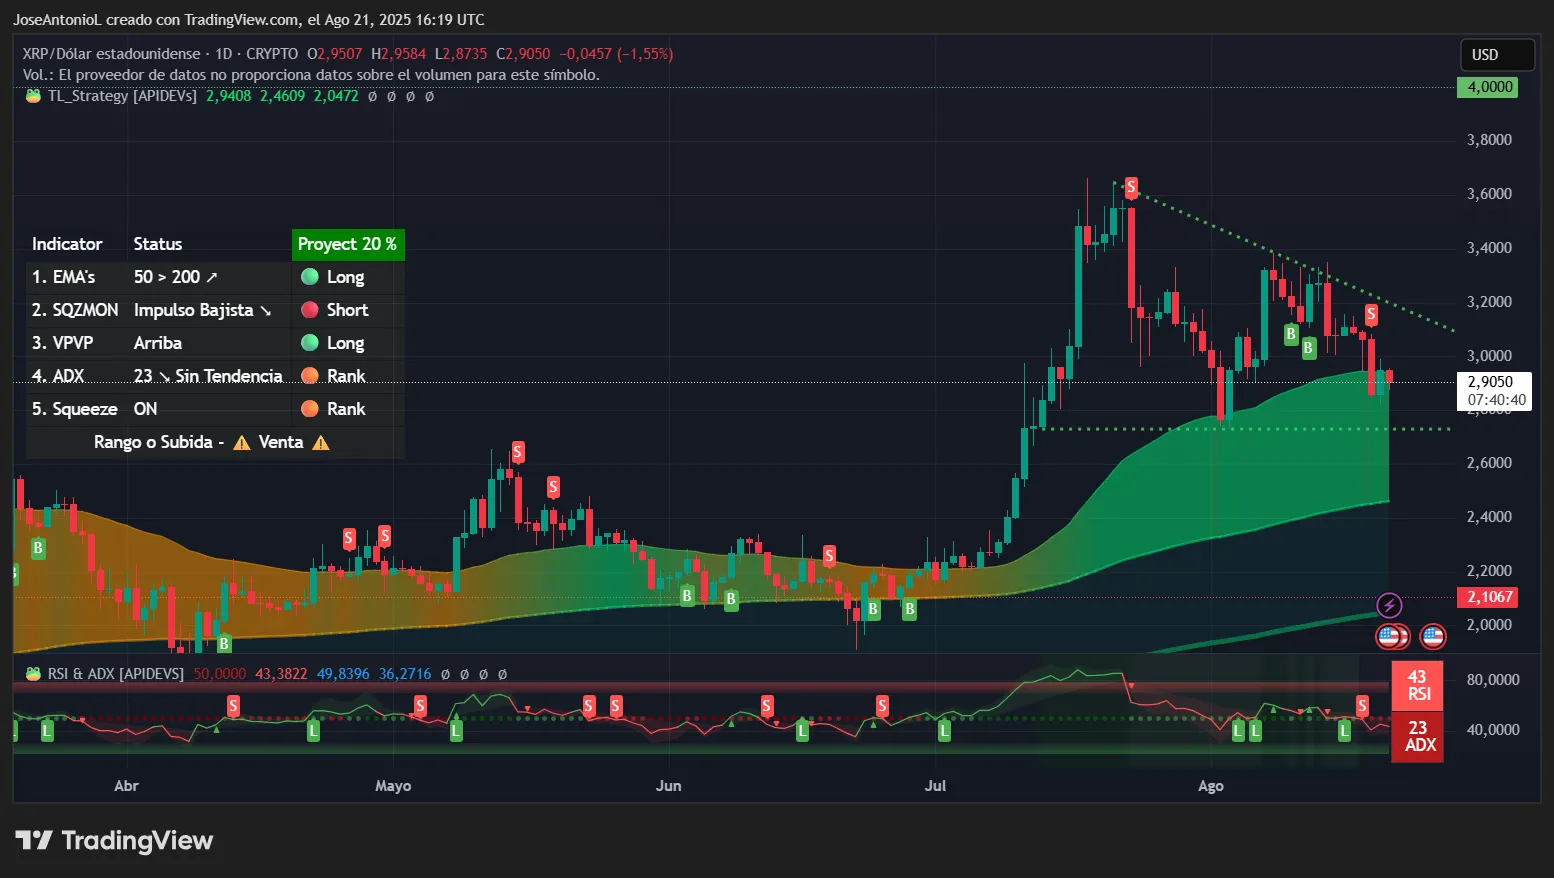
XRP price action today tells the story. The coin opened at $2.9507, tried to break past the psychologically significant $3 level, then rolled over hard to hit lows of $2.8735. It has since settled to around $2.8963. That’s a 1.84% decline that makes things hard for the moon boys who only want number to go up forever.
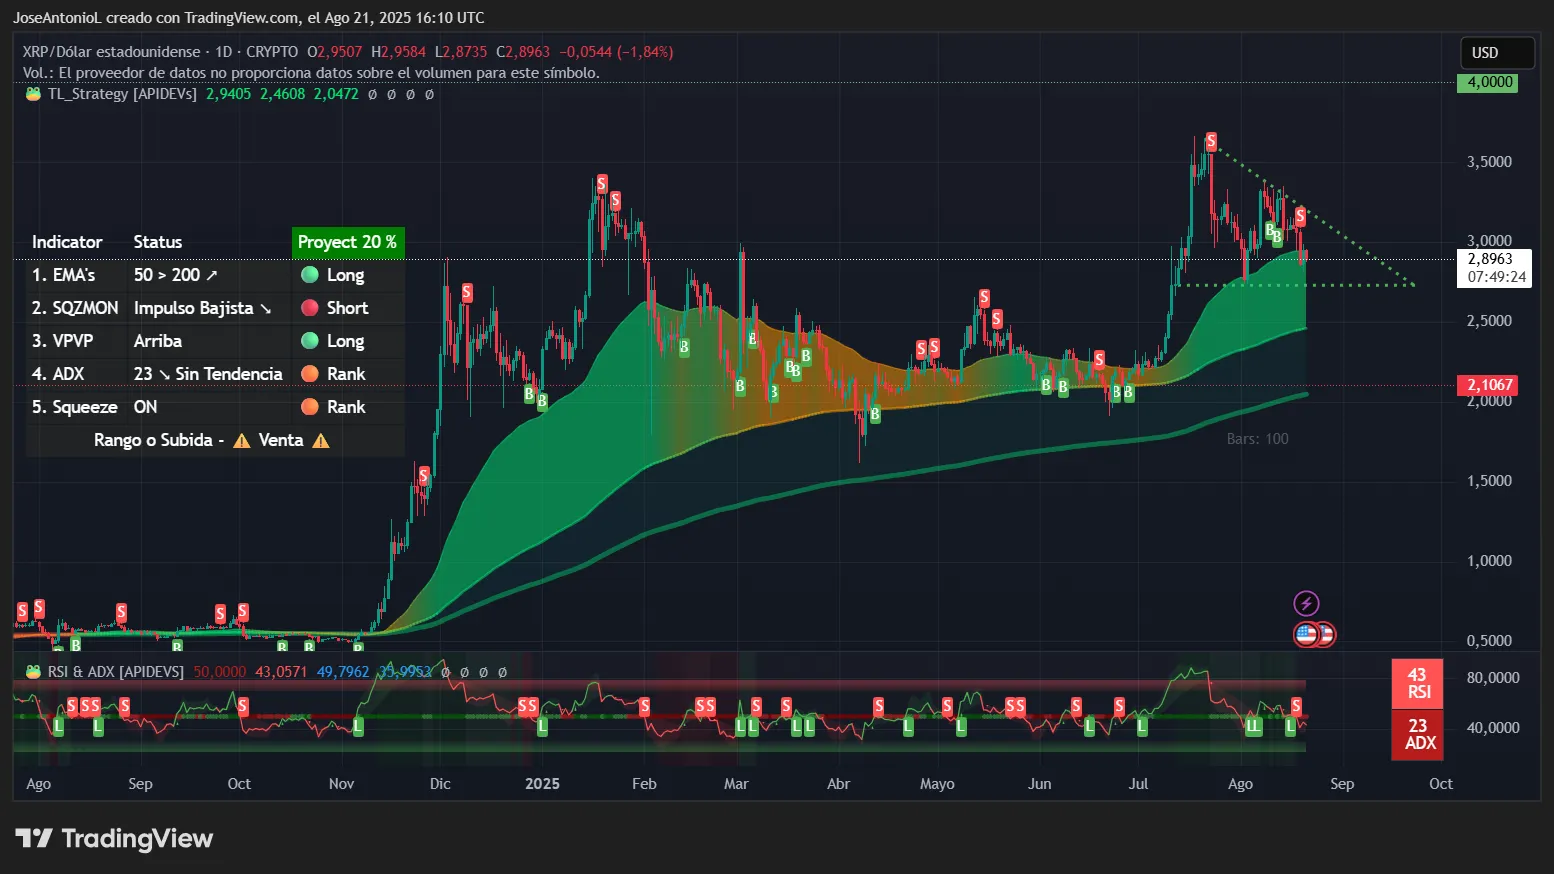
Looking at the daily chart, the price of XRP has done something that many traders would find alarming: the current price has broken below the average price of the last 50 days. Exponential moving averages, or EMAs, provide traders with a gauge of where price supports and resistances are among buyers and sellers. While falling below the 50-day EMA might not be enough to trigger algorithmic sales, Myriad users have something to consider here.
If the XRP market starts treating the 50-day EMA as a resistance, even in an overall bullish trend, it could become increasingly difficult for bulls to break past the $3.00 price mark and reach the $4 “moon” target. On the other hand, $2 is still below the 200-day EMA, which means XRP would need heavy bearish momentum to hit that mark. But such momentum isn’t out of the question, especially considering “red September” is coming and it’s been only down ever since XRP notched its all-time high in mid-July.

What’s more, XRP’s Relative Strength Index, or RSI, has plummeted to 43, well below the neutral 50 level. RSI measures momentum on a 0-100 scale, and readings below 45 often signal that sellers have taken control. This isn’t just a minor dip below 50. At 43, we’re seeing genuine bearish momentum building. Given other variables, traders could easily interpret an RSI below 45 as a warning of more downside to come unless buyers step in aggressively.
XRP’s Average Directional Index, or ADX, is now at 23, falling below the crucial 25 threshold. ADX measures trend strength regardless of direction—think of it as measuring how fast you’re going without caring if it’s forwards or backwards. Readings below 25 indicate no clear trend, just choppy, directionless action. This suggests XRP has lost its trending momentum and entered a danger zone where the permabulls are not strong enough to keep pumping prices.
In general, technical indicators are showing mixed signals and require careful analysis for those willing to make bets. As the box shows, there are long, short, and rank signals all over the place, so oscillators are going wild in the middle of a very noisy zone.
May the odds be in your favor
To make targets easier to understand, below is a broader view of the price trend. Notice prices are currently inside a descending triangle, which by itself is not usually a good sign considering the 50-day EMA has just been broken.
Moon Scenario ($4 – Green Horizontal Line):
- Immediate resistance: $3.00 (psychological barrier and former support)
- Major resistance: $3.30 (triangle breakdown point)
- Moon target: $4.00 (the green horizontal line on chart)
For the 51% moon probability to play out, XRP needs an immediate reversal above $3.00 with massive volume. Without reclaiming the broken channel around $3.30, the path to $4 looks increasingly unlikely. The fact that odds on Myriad have collapsed from 66% to 51% shows the market is losing faith in this scenario.
Doom Scenario ($2 – Red Horizontal Line):
- First support: $2.50 (psychological level)
- Critical support: $2.30 (previous consolidation zone)
- Doom target: $2.00 (the red horizontal line on chart)
The 49% doom probability is gaining momentum. With RSI at 43 and price breaking channel support, a test of $2.50 looks imminent. If that fails, the $2.00 doom target becomes a real possibility. The fact that bearish odds briefly exceeded bullish ones earlier this week shows how quickly sentiment can flip.
The dramatic shift in prediction market odds from 66% bullish to essentially 50-50 tells you everything about market psychology right now. When weighing all of the available technical data, the evidence points toward more downside ahead.
There’s a long way to go before $2 XRP, yes, but the heavy correction after such an unnatural, upward spike is something to consider even in the most bullish scenarios.
Disclaimer
The views and opinions expressed by the author are for informational purposes only and do not constitute financial, investment, or other advice.
Daily Debrief Newsletter
Start every day with the top news stories right now, plus original features, a podcast, videos and more.